
Weiss has been in print for over a decade at this point, so it would not be surprising that certain mechanics change in popularity overtime. Over the years, tons of new mechanics have come and once popular abilities have disappeared. The increase in Resonance and the disappearance of Alarm comes to mind.
What about trigger icons? Since the inception of the game, we have gone from four to eight icons with a ninth coming in 2020. With new icons added to the game, have other icons seen less print in order to make way for the new triggers? Have some original icons become more popular with time? We take a statistical eye to evaluate this question, looking at sets that added at least 20 new cards to the game.
Tl;dr
Bag and Wind triggers have become far less common than they were within their first three years of print. Bag has become very uncommon, being included in only around 10% of sets in 2019. Further, it is fair to consider that Bag is obsolete.
Data at a glance
A detailed list of all Japanese[1] Weiss products released is available over at Heart of the Cards. Overall, about 200 booster or extra sets add at least 20 cards are included in the dataset. This includes every set released from 2008 to 2019, representing 11 years of Weiss Schwarz sets. The majority of sets are full sets, as extra sets were few and far between to begin with, and many didn’t reach the 20 card threshold. Extra sets usually only included climaxes of two colours, which adds quite a bit of variability to the chart in the middle part of the 2010s.
First, we evaluate each set to see if a set has each trigger icon. If a set contains at least one copy of the icon, it is marked as having that trigger icon. We then aggregate the sets by year of release to create a time series for each trigger icon. This gives us eight individual time series, one for each trigger icon. The time series has a range of 0% to 100%, and serve as a frequency of triggers existing in a set for a given year. For instance, the time series for comeback was 100% in 2008, which means that every set that added at least 20 cards included at least one comeback trigger icon.
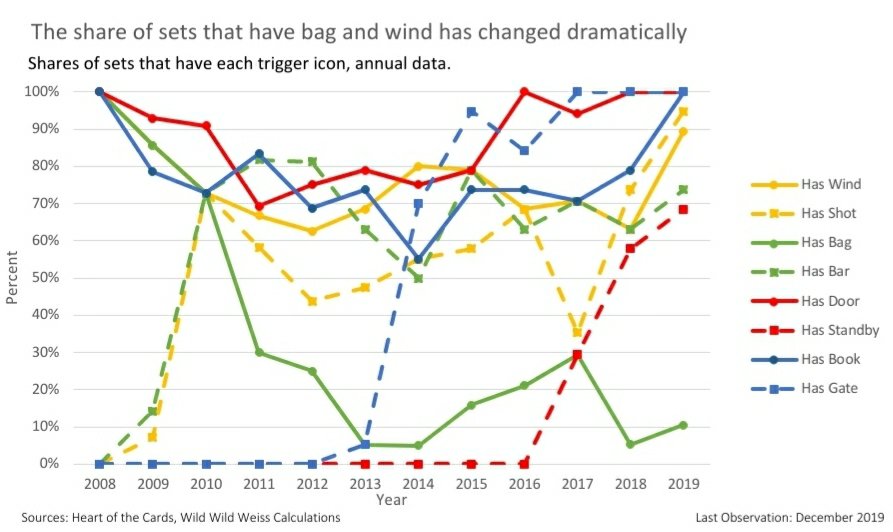
The chart above plots the percent of sets in a year that had each trigger icon. The solid lines are the original four triggers, and the dashed lines are the second trigger in each colour. One trend is immediately apparent: the demise of the bag trigger. Almost immediately after the other green trigger released, the amount of gold bags printed plummeted. Between the start of 2013 and the end of 2014, only two sets had gold bags. The trigger saw a small print resurgence afterwards, but never appeared in more than a third of all sets. Wind also saw a decline when Shot came out, but has become increasingly frequent after Standby came out.
On the other side of the coin, we notice that two trigger icons have become staples: door and gate. Over the past two years these triggers have appeared in every set. Both of these triggers are good triggers and very popular among Japanese players. In fact, the frequency of has door and has gate is a good proxy for extra sets that did not include red and blue.
Fun side note, the new Revue Starlight set is the only set to feature all eight currently released trigger icons in one set.
What we are interested in here, though, is whether these charges are significant compared to their original print frequencies.
Methodology
First off, before I state the specific analysis performed here, it is important to note that the domain for each series, time, is different. This is because the trigger icons came out at different times. Therefore a joint evaluation of whether an overall change in trigger frequency cannot be done. The time series are long enough, however, to see if the individual series have changed. To do that, we compare the entire history of the series to the first three years of the trigger’s existence. If the difference, as scaled by the variability of the individual series, is large then we can say that the frequency has changed.
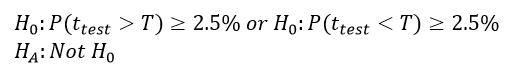
Formally speaking, the null hypothesis is that the mean of distribution that the frequency of trigger icons came from is the same as the mean from the entire distribution.

For simplicity’s sake[2] I have assumed an equal and constant variance over time. When you do this sort of test you are doing a “t-test,” because the test has a known distribution, a t distribution. The fact that it has a known distribution is key, as it means you can ask how frequent the result you see is. In other words, we can figure out the probability of this result occuring now that we know what it’s distribution is. Written formally, our test looks like:
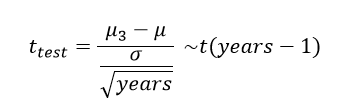
Our test is specifically designed for use with small (not infinite) samples. That’s why the whole thing is scaled by the square root of the number of years in the sample. So, now we want to know how infrequent a result, how big of a t score, is so unlikely to be considered from a different process. The canonical answer, which came from an offhand comment from Ronald Fischer, was 5%. So if the t statistics is so high that it would occur in less than 5% of pulls from the distribution, we should reject the notion that it is from the same distribution.
However, if you look closely at the test defined above, we are actually running two tests at once. Specifically, is the mean of the first three years greater than the total mean and is it less than the total mean. Because we are running multiple tests at the same time, we have to correct for the fact that the more tests you do, the more likely you are going to get a result high enough to reject a null hypothesis by pure chance. Luckily, it’s as simple as dividing your desired rejection rate by the number of tests you are doing. So instead of rejecting t statistics that are larger than only 5% of the distribution, we are looking at those smaller than only 2.5% of the distribution and larger than only 2.5% of the distribution[3].
The results from the test are presented in the table below:

Given the noted large drop and absence of bag triggers, we can test if we can say that bag triggers statistically do not exist using a similar test. We replace the historic mean with zero, the null hypothesis being that bags are not real, and the test mean with the number printed in 2019. Since our variable can’t go below 0, we do not have to divide 5% by two because we are only doing one test. The result for the test are below.

Results
We can say that compared to their first three years of print, the print frequency of Wind and Bag have changed. Both are less popular than they were during initial print. In fact, we fail to reject the null that the amount of bag triggers printed is not zero. Thus it is fair to consider that the Bag trigger is not really being printed anymore.
Funnily enough, even though door and gate have become staples, they were highly printed to begin with. This means that the frequency that they were printed at has not significantly changed.
Conclusion
Mechanics come and mechanics go, their popularity waxes and wanes. The popularity of wind and bag has declined since their introduction in 2008. Thus, it is not surprising that the new trigger coming in 2020, Choice, appears to be coming to yellow. However, it does neglect that green has essentially become a colour with only one special trigger. If anything, this means that Green should be the colour to get its third trigger next. Funnily enough, bag’s weakness is likely why bar came out in 2009 along with shot. Here’s hoping that Bushiroad proves me right two years down the line.
[1] The English only sets both have Bag triggers.
[2] There are some variance blend methods that get around Behrens-Fischer problem, but that would take way more effort and probably won’t really effect the results of an article about waifu cards. I also really don’t want to deal with infinite variance and other time series BS today.
[3] For those that care, this is known as a Bonferroni correction.

So I was curious how this has changed in the past few years (2020-2023):
Wind: 83%, 42%, 26%, 23%
Shot: 0%, 17%, 11%, 8%
Choice: 89%, 88%, 100%, 88%
Bag: 44%, 13%, 0%, 12%
Bar: 89%, 75%, 84%, 65%
Door: 100%, 83%, 89%, 96%
Standby: 61%, 88%, 89%, 69%
Book: 67%, 50%, 63%, 15%
Pants: 94%, 96%, 100%, 92%
Caveats:
This excluded TDs entirely (though they generally make the 20-card cutoff). Not sure how those were handled originally, but if you include them as part of the associated booster, that adds: 1 each of choice, bag, & book in 2020 (putting them to 94%, 50%, and 72% respectively); 3 winds, 1 shot, 1 bag, & 2 books in 2021 (putting them to 54%, 21%, 17%, and 58%); 2 shots, 1 bag, & 1 book in 2022 (putting them to 21%, 5%, & 68%); and 1 shot in 2023 (putting it to 12%)
I also suspect it would be better to look at the percentage only of sets that had a given color, or perhaps the percentage of the overall count of climaxes of a given color, but that’s a separate thing.
Observations:
Door and pants have continued to be staples, though mostly haven’t been at 100% (likely due to premium boosters, though there are a couple full boosters without them).
Bar is slightly higher, though with some variation.
Standby may have peaked in 2021/2022? Or maybe it’s just variation like bar.
Wind has fallen off pretty steeply it seems, but not as much as shot.
Unsurprising I suppose, with the introduction of choice, which has consistently been a staple around the level of door since it was introduced.
Book fell off sharply, like wind, though it doesn’t have the excuse of a new trigger being introduced.
Bag jumped up in 2020 but then went back down.
LikeLike
Thanks for the update, and it kind of jives with what I see in people’s decks. For some reason I remember Afterglow being the one deck where I saw bag but I’m probably rememberinf wrong.
LikeLike