
The poor quality of translations for the English Edition of Weiss Schwarz is a constant issue. In 2019, Bushiroad even apologized for the quality of their translations on the Weiss Facebook page. At the time of writing, Fujimi Bunko has already had seven translation errors in their Card of the Day teasers. Translation, especially between languages as dissimilar as English and Japanese, is difficult and prone to differing interpretations of the same texts. However, are these errors occurring at a similar rate as other card games, or has Bushiroad been making an inordinate amount of errors?
After the latest round of translation errors for new sets coming to English Weiss, I decided it was time to figure out how common these errors are. In this blog, I calculate how frequently mistranslations and consequential misprints occurr in Weiss. Second, I compare Weiss Schwarz with another TCG with an original version in Japanese, Pokémon, to see if Weiss is worse in this regard when compared with their peers. Finally, I model errors to determine whether certain set characteristics predict set errors.
Tl;dr
The average Weiss set has somewhere between two to three errata in it, and about 89% of sets have at least one error in them. Pokémon, on the other hand, has less than one errata in each set, and the fact that English Pokémon routinely combines small Japanese sets into a small number of large sets inflates the percentage of sets with an error in them. There is very strong evidence to reject the null of Pokémon and Weiss having the same rate of errors in production and accept the alternate that Bushiroad makes more errors in the English Edition of Weiss Schwarz than the Pokémon Company makes in the English Edition of the Pokémon TCG. Although the regressions have a poor fit, it appears that increasing the number of cards in a set slightly increases the number of errors present and the chance of an error occurring at all. For each additional card added to a set you add 0.04 errors to it and increase the chance of one error increasing by 4%.
Data Description
I obtained information for English Weiss Schwarz sets directly from the official website. Information on set size and release date come from the product information pages for each set. I include both full sets and extra sets in the data set. I include cards from the main booster, trial deck exclusive cards, and PR cards that are included in the deck”s set list to ensure maximum congruence with the Pokemon TCG. Cards that have been altered multiple times are treated as a single error. I also note whether the set is an amalgamation of other sets. Errata information comes from the official errata page. Relying on the official errata page will likely under-count the true number of errata, as it will only contain errors people notice. Under-counting errors makes the measure more conservative in the sense that it is less likely to suggest that Bushiroad has a quality assurance problem.
When counting errors, typogarphical and print errors are considered. Post-Hoc changes to set codes are not considered errors. Examples of errors include: Simple typos, Mistranslations, Altering Language, forgetting to print cost on the card, and printing the card in the wrong colour.
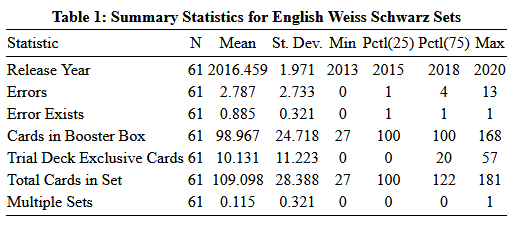
The average Weiss set has 2.8 errors in it, with a large standard deviation about the size of the mean itself. This suggests that the overall quality of Weiss sets varies widely from series to series. However, most sets will have at least one error, as the interquartile range of errors per set is 1-4 errors. If we lined up all the English Weiss sets by the number of errors in them, the middle half of that line up would have at least one error but no more than four. We also know that a quarter of sets have one error or less and a quarter of sets have three or more errors. The maximum is Disgaea with 13 errors in a 165-card set, an error rate of 9%. The Errata Exists variable is a dummy variable that is coded 0 if there are no errors and 1 if there is at least one error. Due to the definition of an average, the average of this variable is the percentage of sets that have an error in them. A full 89% of sets have at least one error in them. Given the binomial nature of this variable and the high chance of an error occurring, a low standard deviation is not surprising.
For the Pokémon TCG, errata are slightly more complicated. One look at the official errata documents produced by the Pokémon company reveal that the errata list is more often used to change the rulings on correctly printed cards than to correct print errors. For instance, Pokémon Catcher was changed to require a coin flip because the card’s effect without the coinflip was far too powerful. They also errata old Trainer (think event) cards with the same name as cards they want to print with different abilities. Recently, they altered the text of Quick Ball from Mysterious Treasures, a 2007 set. Quick Ball had its ability completely changed by Nintendo because they wanted to use Quick Ball for a different purpose in Sword and Shield. Luckily, Bulbapedia has collected a page on errata that exclude rule changes. The Pokémon data set begins in 2013 to ensure that it covers the same period as the English Weiss data. Pokémon errors include errors such as incorrect energy costs, wrong backgrounds, typographical errors, mistaken art attribution, and other such errors.
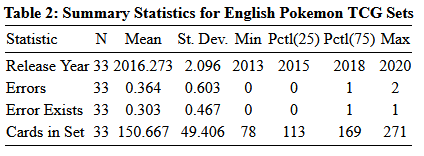
Two structural differences between Pokémon and Weiss become immediately apparent. English Pokémon sets are less frequent than English Weiss sets but are much larger. Since 2013, there have been 33 Pokémon sets and 61 Weiss sets in English. Pokemon sets released in Japan are smaller, and tend to be sold in cheaper booster packs with fewer cards in them that The Pokemon Company rolls the smaller Japanese sets into the larger International sets with larger individual booster packs. This will inflate the Errata Exists variable relative to Weiss since the denominator is smaller. Thus, the meat of the comparison between the two sets will focus on the error rate in terms of cards and not sets. We divide the number of errors in each set by the cards in the set to find the error rate within each set. Since Pokémon sets can get as large as 270 cards while Weiss sets are typically 100 cards and an additional 20 cards from the trial deck, working in rate space allows for apples to apples comparisons. For visual aid, I aggregate errors and total cards by year of release before dividing when making charts. By aggregating by year of release, we also get a rudimentary sense of if things have been getting better or worse over time.
Visual Comparison
The two graphs below paint a picture of two vastly different trajectories. The Pokémon Company appears to have noticed a situation they did not like and corrected for it while Bushiroad SEA happened to have one good year and made no visibly appreciable changes to their translation or quality control methods.
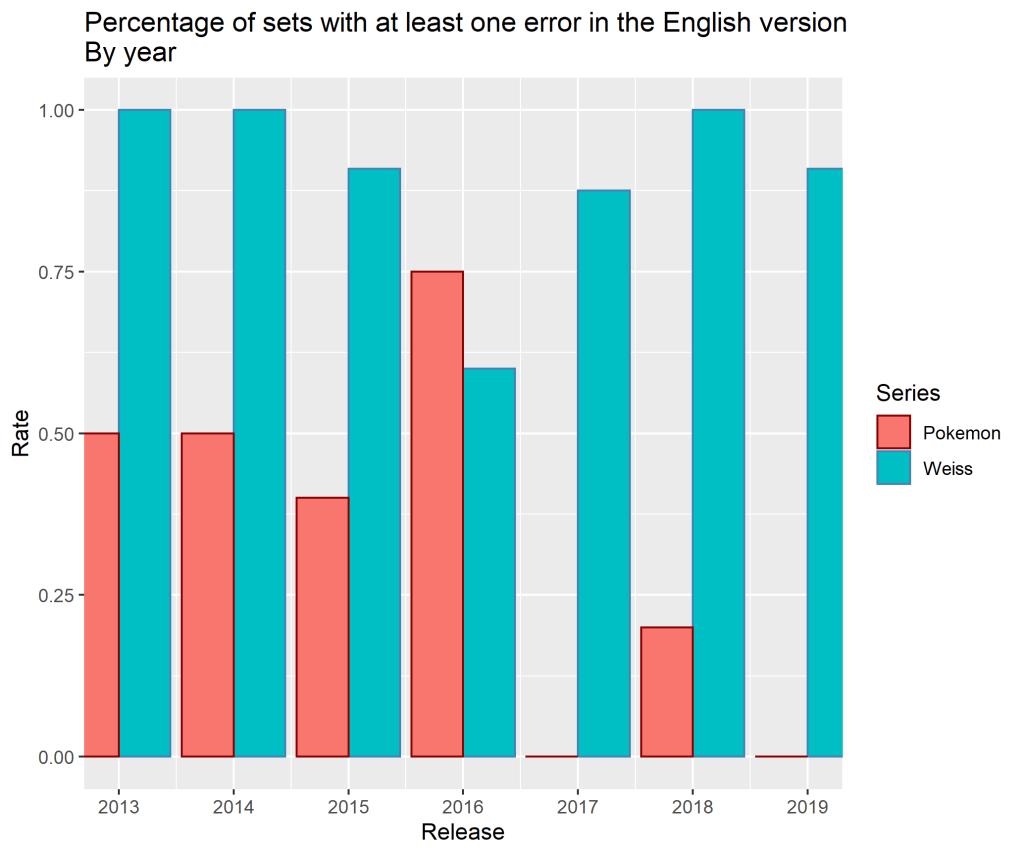
When we consider the percentage of sets with at least one error within them, both games have somewhat stable error rates for the first few years of the sample. However, in 2016, Pokémon made at least one error in all but one set while Bushiroad has their year with the most error-free English Weiss sets. That year is also the only year where Pokémon has a higher proportion of sets with errors in them than Weiss does. Mind you, it is still a smaller number of sets with errors in them, 3, than Weiss had, 6. In the following years, Weiss’s error rate returns to what it previously was while Pokémon has only a single error from 2017 until now, a typo on Cyrus Prism Star.
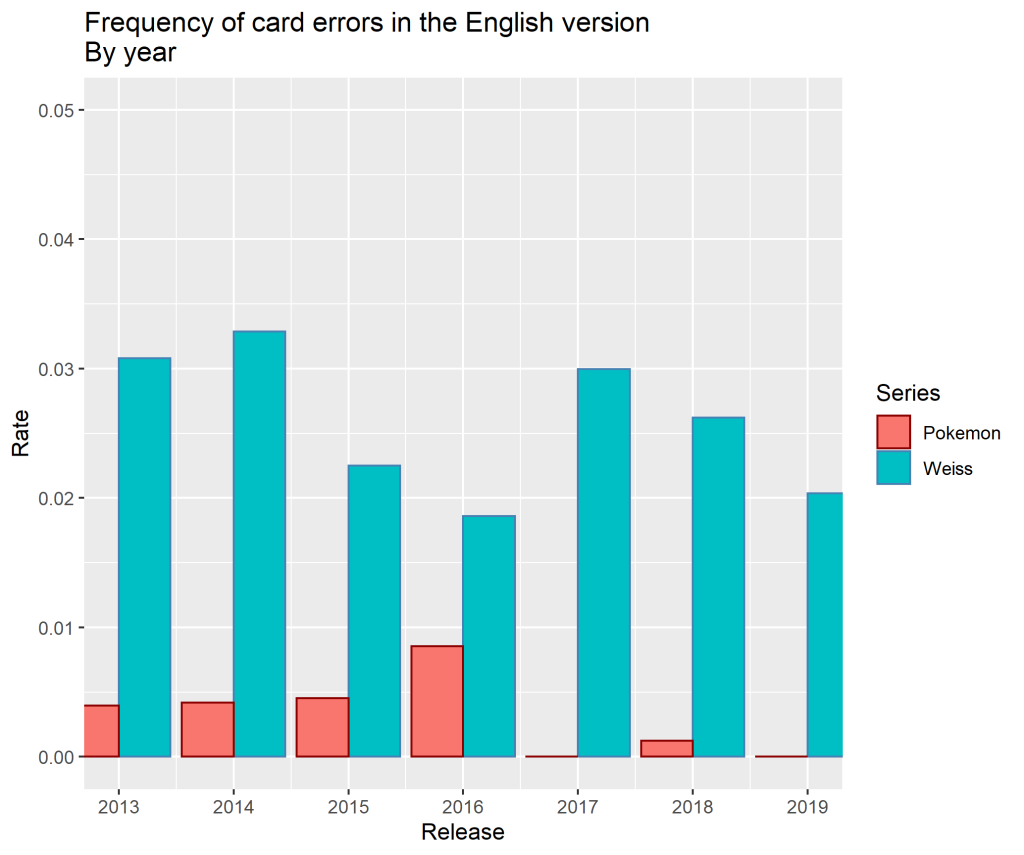
When we consider the frequency of individual errors, any seeming parity between Pokémon and Weiss disappears. The error rate of the Pokémon TCG never reaches 1% while the error rate of Weiss Schwarz is routinely over 2% and has previously breached 3%. It is readily apparent that Pokémon’s translation talent, quality assurance, or both has always been better than Bushiroad’s. It is also commendable that the worst year for errors in Pokemon was still a year where fewer than 1% of cards had some sort of error. Bushiroad’s best year, 2016, was a large improvement over previous years but could not be maintained.
Statistical Comparison
A visual comparison gets the point across perfectly well, that Weiss’ error rate is high compared to Pokemon’s, however this wouldn’t be a Weiss by the Numbers blog post without applying more statistical analysis than is truly necessary. If math isn’t your thing, feel free to skip to the end. So, can we formally say that Weiss has a worse error rate than Pokémon? Luckily, there is a relatively simple tool to deploy to test the null hypothesis of whether the error rates of Pokémon and Weiss are the same against the alternative hypothesis that Weiss is worse. That means we can use the one-sided version of the t-test I deployed when we were looking to see if Bag trigger was still in print.
Formally, we are testing:
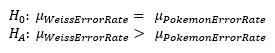
To fit this into our usual T test framework, we re-arrange the null hypothesis:
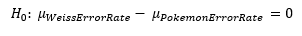
Unlike last time where I assumed that the variances were the same over time for simplicity’s sake, I cannot be lazy this time since we know that the standard deviation of the error rate in Pokémon and Weiss are different and they arise from obviously different processes. Luckily R deployed the appropriate correction, the Welch Two Sample t-Test, for me and did the necessary degrees of freedom adjustments. The test results are in Table 3 below.
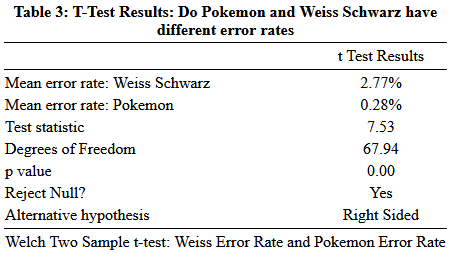
We reject the null hypothesis that the Weiss and Pokémon errata rates are the same. The English edition of Weiss Schwarz has a significantly higher error rate than the English Edition of the Pokémon Trading Card Game.
What influences the error rate
Note: The r-squared, the standard 0-100 measure of how well a model fits the data, on all these models is somewhere between “low” to “horseshit.” These are for funsies only. Which means APA formatting of course.
Given that Weiss has a worse error rate than Pokémon, I turn my attention to what could influence the number of errors in a Weiss set. The best tool to determine this is linear regression. Linear regression looks to estimate the conditional average of a variable. The conditional average is the average outcome of a dependent random variable Y given some knowledge of an explanatory random variable X. There are many resources online that show if your data plays nice[1], the best linear estimator of the conditional average is the following equation[2]:
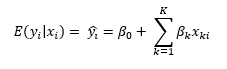
Where y-hat is the predicted value of y:

And epsilon is the prediction error, the difference between the real observed value of our value of interest, in this case errors in a set. The indexer i is for sets, this means that the relation we estimate is for a general set, estimated from each set being taken as one observation. The x variables are the variables we bring in to explain changes in y. Our most basic model (model 1 under OLS[3]) brings number of cards in a set and whether the set is an amalgamation of multiple sets. The βk term is then the effect of a one-unit change in x on y. For instance, in our first model, the value of βk for Cards in Set is 0.04, which means that for each additional card in the set, you can expect another .04 errors. Since the model is linear, the effect is constant over the domain of the variable. Each additional card will increase the predicted errors by 0.04 cards. Thus, increasing set size by 100 cards would on average add 4 more errors to the set. The regression constant, β0, has no meaningful interpretation in any of these models since I did not center the data. Since we are talking about specific items, specifically cards and errors, I felt the other betas had a more natural interpretation uncentered. When you center the data, you must interpret in terms of standard deviations. The coefficient represents the model’s baseline value when all numbers are zero. Since there are no zero card Weiss Sets, it gives us no real intuition outside of predicting the number of errors in a set given values of the predictor variables.
The table below reports a number below the estimated beta coefficient in parenthesis. That number is the standard error. It is a measure of how precisely we estimated the effect. The smaller the standard error, the more precise the estimate. In terms of our first model, only cards in set is estimated to a reasonable level of preciseness. The two stars next to the coefficient for Cards in Set means that the coefficient is statistically significant from zero if we use a significance level of five percent using a t-test based on the coefficient value and the standard error as the mean and variance. Essentially, we are reasonably sure that we are estimating an effect that is not zero. Roughly speaking, if the estimated value of the coefficient is twice as large as the standard error, you have a statistically significant relationship. We cannot say that about the other variable, multiple sets.
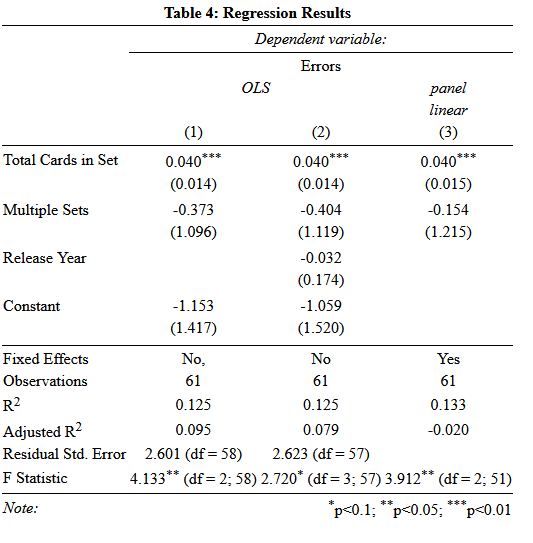
The columns each represent one estimated model. Column two adds a time trend to the model and estimates using Ordinary Least Squares. The time trend, if well estimated would tell us if Bushiroad is getting better (or worse) over time. Since OLS is a linear estimate, this form restricts us to asking whether it is a constant trend over time. Unsurprisingly, it is not significant. If we look back to the graphs of error rate by year, an insiginifcant time trend lines up with a picture that declines then increases within a similar range. The coefficient for Cards in Set does not change much when we add the new variable, suggesting that we are safe to omit the time trend from the model[4].
The last model, panel linear, is slightly different than OLS. Instead of having a baseline constant, we suggest that staff turnover year to year has an unknown effect on the quality of the set. To model this, we add a dummy variable for every year except for one and remove the regression constant. This is known as a fixed effects model, and each dummy variable is a fixed effect. It is considered bad form to report the coefficients for each fixed effect because they are part of your error term (they are unexplained after all), unless certain Fixed Effects have important well understood interpretations, but it is standard practice to report that you included them with a simple Yes/No[5]. The estimated value of Cards in set is stable in this model as well. This suggests that perhaps there is something here, despite the garbage within effect r-squared[6].
Another way we can look at this is in terms of a probability model, or what is the chance a set will have at least one error in it. Probability models don’t fit well with OLS because unlike a line that goes to both infinities, probabilities are bounded to be between 0 and 1. On top of that, the most basic form of a probability model, the Cumulative Density Function is a sigmoid function (Think of a shape like this: _/¯͞ ). Luckily, there are regression methods that do estimate things like that, Logistic Regressions. Logistic Regressions use the logistic function, the logarithm of an odds ratio (think 2:1 odds like in sports betting), to estimate how an explanatory variable influences whether a dependent variable is 0 or 1. Our variable to measure whether an error exists in a set is already set up this way, so we can easily calculate how a change in our explanatory variables.
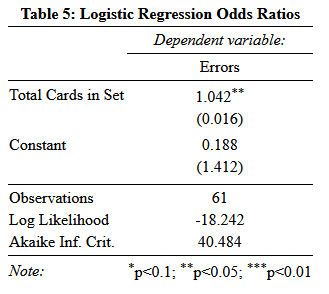
The logarithm of the odds ratio is then our link between a linear model and a nonlinear space we want to work in. However, since we are working in a nonlinear space, our coefficients do not have a nice, universal interpretation. How you interpret them relies on where you are in the distribution. Using number of cards as an example, the effect of one more card in the set depends on whether there are 27 or 100 in the set already. However, one nice feature of the odds ratio as a link function is that is gives us the odds ratio itself as an easy way to interpret the coefficients, once we convert them back through the link function. The odds ratio tells us by how much the odds of something will increase multiplicatively when the explanatory variable increases by one. The estimated odds ratio for the number of cards in the set is 1.042, so for each time you add a card to a set you increase the odds of an error by 1.042 times. In other words, an increase of about 4%.
So what does it all mean?
From all the work done above, we can see two things. First Weiss has a higher rate of errors than another, albeit better established, card game. Second, from both visual and regression analysis, we can tell that it is not getting better with time. The proof is in the pudding, after apologizing for the quality of translation in September 2019, Bushiroad proceeds to release their worst set yet in terms of errors, Jojo with 9, in December. Size of set might predict the number of errors, but given most sets are 100 cards, that is cold comfort if you are trying to avoid buying into a set with an egregious number of errors in them. This is a problem that players and Bushiroad are both aware of but, if Fushimi Bunko is any example, will take a long time to correct.
Correction Notice: A previous version of this article reported statistics derived from a data set that accidentally omitted the trial deck exclusive cards in each set. Including these cards in the analysis does not alter the overall results, but slightly understated the overall error rate in Weiss and the number of sets that had at least one error in them. The outcomes of all statistical tests became slightly more suggestive of what causes errors and if Pokemon and Weiss have different error rates.
[1] A common statement of these ways of playing nice is the Gauss-Markov theorem,
[2] It’s also important to note that the conditional average of joint normal distribution of two variables also takes this form. Math is magical when it works out, isn’t it?
[3] OLS means Ordinary Least Squares, the method I used to estimate the linear regression model above. There are other methods such as General Least Squares (GLS) or estimation by Maximum Likelihood, but OLS is the most robust. It works well when playing nice assumptions are violated in small sample but could hold at the asymptote and you have no idea what the actual underlying distribution of your data or estimators looks like. GLS needs you to know what the variance covariance matrix looks like before you estimate and Maximum Likelihood requires knowledge of the underlying distributions of what you are trying to estimate. Unlike OLS which asks you to pretend that the asymtotics work, GLS and Maximum Likelihood asks a ton out of you.
[4] The coefficient for multiple sets changes more, but since it wasn’t precisely estimated to begin with, it doesn’t give us much information in regards to omitted variables.
[5] It is often the case that you will have many fixed effects, so reporting them becomes cumbersome.
[6] The within effects r-squared is the appropriate measure to compare a Fixed Effect model to an OLS model, since it is telling us how well our explanatory variables and not the fixed effects explain the data. The total r-squared for both the explanatory variables and the fixed effects is almost 60%.

2 thoughts on “Weiss by the Numbers: Is English Weiss Schwarz worse for Translation and Print Errors than other English editions of Japanese trading card games?”